

Occupancy analytics for rental property means tracking tenancy status, vacancy and turnover through reconciled collections data rather than a single snapshot. The best practice is simple to state and hard to do well: calculate economic vacancy from a 12-month ledger, not a one-day rent roll. This article covers the KPIs, the formulas, a 90-day rollout, and how a platform like Prop Report operationalises the reporting.
TL;DR:
- Calculating economic vacancy from a 12-month ledger provides a more accurate assessment of income loss than relying on physical vacancy alone.
- Proper data reconciliation requires consolidating lease dates, payments, concessions, and re-let costs across systems, not just snapshots from rent rolls.
- Key occupancy KPIs such as days on market, collection rate, and turnover frequency should be tracked monthly and segmented to identify specific causes of vacancy changes.
- Improving data discipline and automating ledger reconciliation through platforms like Prop Report can significantly reduce reporting errors and reveal hidden income loss.
- Using vacancy trends alongside loss-to-lease data enables targeted pricing adjustments and better maintenance planning, increasing retention and revenue.
Table of Contents
- What is the difference between physical and economic vacancy?
- How do you calculate occupancy and vacancy accurately?
- Which occupancy KPIs actually belong on your dashboard?
- How do you build a reliable occupancy analytics process in 90 days?
- How should occupancy data inform your rental pricing?
- How does occupancy data guide maintenance and renovation planning?
- Can occupancy trends improve tenant retention?
- What does effective occupancy analytics look like in practice?
- What goes wrong when collecting occupancy data?
- Prop Report perspective: fixing the ledger problem at source
- See how Prop Report handles the ledger for you
- Sources
What is the difference between physical and economic vacancy?
Physical vacancy counts empty days. Economic vacancy counts missing pounds. They rarely tell the same story, and property managers who only track the first one are usually flying blind on the second.
Physical vacancy is the simplest measure: vacant days divided by rentable days across a given period. A ten-unit block with one flat empty for 30 days in a 365-day year has a physical vacancy rate of a low single-digit percentage. It looks healthy on paper.
Economic vacancy tells a different story. It's calculated as gross potential rent minus rent actually collected, divided by gross potential rent, and it captures everything the physical figure misses. Suppose that same block has gross potential rent of £120,000 a year. One tenant gets a two-month rent-free incentive, another falls behind on payments for several months, and a third unit sits empty for those 30 days. Collected rent is significantly less, so economic vacancy is notably higher than the physical vacancy figure.
Pro Tip: Run both numbers side by side every month. A large gap between physical and economic vacancy is usually a concessions or arrears problem, not a leasing problem, and it needs a different fix.
Vacancy bands vary by property class. Purpose-built residential tends to show lower vacancy than older secondary stock, while student or short-let portfolios typically experience higher turnover than family housing. However, class-average bands matter less than a portfolio's own trend line, and economic vacancy calculations that ignore concessions and non-payment routinely understate real income loss. Average tenancy duration tends to affect economic vacancy more significantly than small reductions in time-to-relet, since new tenancies involve additional marketing, void, and administrative costs that renewals avoid.
How do you calculate occupancy and vacancy accurately?
Getting the formula right is only half the job. The other half is having clean data to feed it, which is where most portfolios actually fall down.
1. Calculate physical vacancy on a days basis, not a units basis. For a small portfolio, count vacant days rather than vacant units: sum the empty days across every unit in the period, divide by total rentable days. A five-property portfolio with one flat vacant for 45 days out of 1,825 total rentable days gives a physical vacancy rate of a low single-digit percentage.
2. Calculate economic vacancy in currency, not just percentage. Take gross potential rent for the period, subtract actual collections (net of concessions, discounts and unpaid arrears), and divide by gross potential rent. A landlord with £60,000 gross potential rent who collects less due to concessions and arrears experiences economic vacancy worth a notable portion of rent revenue.
3. Assemble the required data fields before you calculate anything:
- Lease start and end dates for every tenancy
- Payments received, dated, against scheduled rent
- Concessions and discounts, with values and duration
- Move-out date and make-ready duration
- Days marketed before re-let
- Re-let costs (marketing, cleaning, agency fees)
4. Reconcile monthly and roll up to 12 months before drawing conclusions.
Three mistakes derail this process consistently. Teams calculate vacancy from a single strong or weak month and treat it as representative. They double-count vacancy days when a unit changes hands mid-month. And they exclude concessions from the arithmetic entirely, which flatters the numbers and misleads everyone reading the report. Scenario tools that model vacancy loss against gross rent are useful precisely because they force concessions and arrears into the calculation rather than letting them hide.
Which occupancy KPIs actually belong on your dashboard?
Not every number deserves a place on a monthly report. The ones that do share one trait: they change how you act, not just how you feel about performance.
The core set includes occupancy rate (the inverse of physical vacancy), economic vacancy rate, days on market (time from vacancy to signed lease), average tenancy duration, turnover frequency (leases ending per year as a share of total units), collection rate (rent collected as a percentage of rent billed), and loss-to-lease (the gap between market rent and actual contracted rent on renewed leases).
Raw portfolio averages hide the interesting detail. Segmenting by asset class, submarket and floor plan, then tracking trend lines rather than single-period snapshots, tends to expose the actual cause of a vacancy spike faster than an aggregate number ever will. A cohort view, comparing tenants who signed in the same quarter, often reveals retention problems tied to a specific building manager, a rent increase, or a maintenance backlog.
Cadence matters as much as the metric itself:
- Monthly: operational dashboard with occupancy, economic vacancy and collection rate by property
- Quarterly: strategic review with trend charts, a waterfall breakdown of economic vacancy drivers, and per-unit tables for underperforming assets
- Red flags: economic vacancy exceeding physical vacancy by more than five percentage points, average tenancy duration falling two consecutive quarters, or collection rate dropping below 95%
How do you build a reliable occupancy analytics process in 90 days?
Most portfolios don't need better software before they need better discipline. The rollout below assumes you're building the habit first and automating it second.
Day 1 to 14: gather and map. Collate the ledger, tenancy register, concessions log, marketing spend and make-ready costs for the trailing 12 months. Assign a single owner for each data source, because ambiguous ownership is the single biggest reason ledgers go stale.
Day 15 to 30: connect and reconcile. Integrate the accounting ledger, CRM, listing feeds and maintenance system so reconciliation stops being a manual, monthly scramble. Automating this step is where most time savings come from, since manual ledger assembly is usually the slowest part of the whole process.
Day 31 to 60: baseline and normalise. Calculate physical and economic vacancy for the trailing 12 months, adjust for seasonal patterns (student lets and holiday markets swing hard by month), and set realistic targets by asset class rather than a single portfolio-wide number.
Day 61 to 90: model and prioritise. Run a simple scenario: what happens to economic vacancy if average tenancy duration rises by two months? Reducing turnover typically saves more than shaving days-on-market, because every new tenancy re-triggers marketing, cleaning and leasing costs that a renewal avoids entirely. Prioritise pre-letting during the notice period and structured renewal incentives over marginal improvements to listing speed.
Pro Tip: Set your first target on collection rate, not occupancy rate. A portfolio can look fully let and still be bleeding income if arrears are climbing quietly in the background.

How should occupancy data inform your rental pricing?
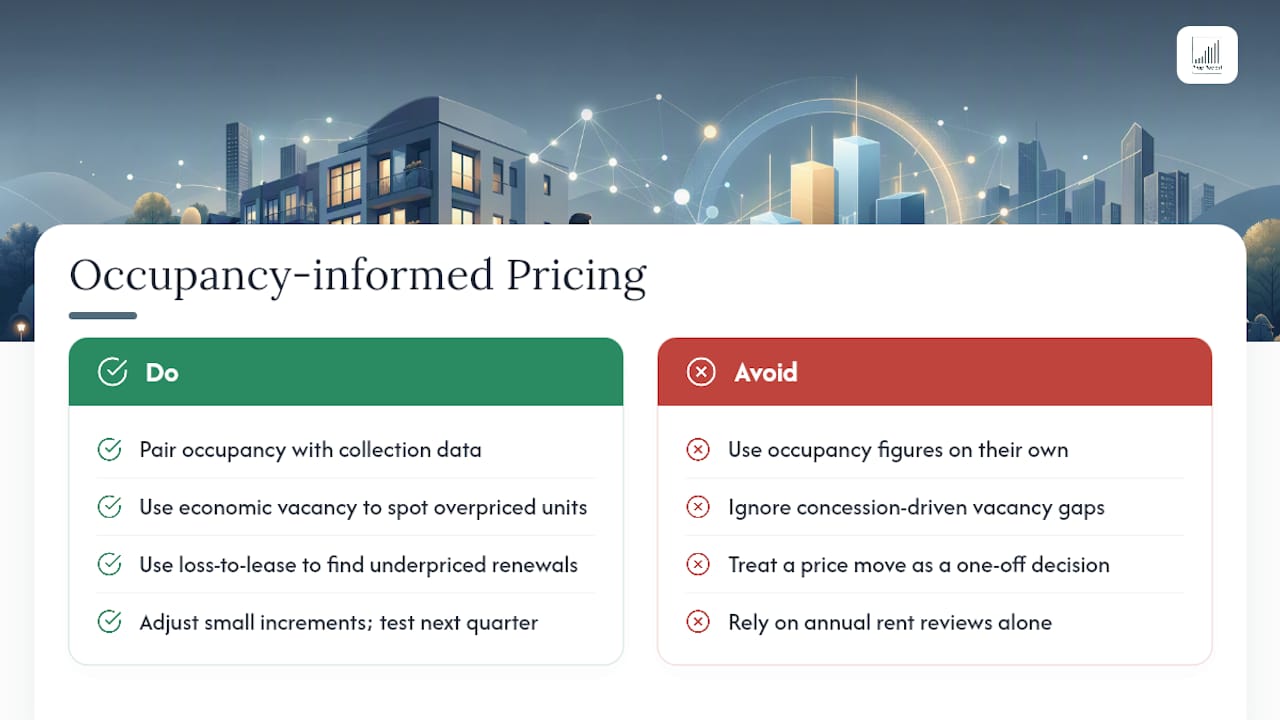
Occupancy figures on their own tell you what happened. Paired with collection data, they tell you what to charge next.
A unit that leases within days at asking rent but shows a rising economic vacancy gap is a pricing signal in disguise, usually pointing at concessions being offered to close deals that the headline rent doesn't reflect. If three units in a submarket all show days-on-market creeping upward while collection rates hold steady, that's a demand softening, not a collections problem, and it argues for a pricing adjustment before the vacancy shows up on the ledger.
Loss-to-lease is the sharper tool here. Comparing contracted rent on renewals against current market rent for the same floor plan shows exactly how much revenue a portfolio is leaving on the table through under-priced renewals. A landlord who renews five tenants a year at 3% below market on a £15,000-a-year unit is quietly losing £2,250 in rent that never shows up as vacancy at all.
The practical rule: use economic vacancy trends to spot where rent is too high (concessions climbing, tenancy duration falling) and loss-to-lease to spot where rent is too low (renewals settling well under market with no resistance). Adjust in small increments, watch how days-on-market and renewal rate respond over the following quarter, and treat any pricing move as a hypothesis to test against the next reporting cycle rather than a one-off decision. Portfolios that review pricing quarterly against these two signals tend to correct faster than those relying on annual rent reviews alone.
How does occupancy data guide maintenance and renovation planning?
Vacancy data is a maintenance forecasting tool most landlords never use as one. Make-ready duration, the time between move-out and a unit being marketable, is really a proxy for how much deferred work has piled up on a property.
If make-ready duration is climbing across a block while tenancy duration holds steady, that's usually a sign of ageing fixtures or a maintenance backlog rather than a leasing problem. Tracking make-ready days alongside re-let costs by property, not just by unit, surfaces which buildings are quietly consuming disproportionate refurbishment spend every time a tenant leaves.
This has a direct budgeting use. A property with average make-ready time of four days and low re-let cost is not a renovation priority. One with average make-ready time of three weeks, rising re-let costs, and turnover concentrated in the same handful of units is a strong candidate for a mid-cycle refurbishment rather than repeated patch repairs after every move-out.
The 12-month ledger view also flags timing. Renovations scheduled around natural vacancy peaks (end of academic year, end of a common lease-renewal month) cost less in lost rent than works forced through mid-tenancy or during a low-vacancy season when contractor availability is tighter. Portfolios that map planned works against their own seasonal vacancy pattern, rather than a generic maintenance calendar, tend to get more refurbishment done per pound of lost rent.
Can occupancy trends improve tenant retention?
Retention is the lever most portfolios underuse, largely because vacancy reporting tends to focus on filling empty units rather than preventing them.
Average tenancy duration is the single clearest retention signal on a dashboard, and it deserves more attention than it usually gets. A portfolio where average tenancy has fallen from 22 months to 16 months over a year is losing money on repeat marketing, cleaning and leasing fees even if occupancy rate looks stable, because those costs land every time a unit turns over regardless of how quickly it re-lets.
Cohort analysis, tracking tenants by the quarter they signed rather than looking at the portfolio in aggregate, tends to expose which buildings or managers are driving early departures. A cluster of tenants leaving within their first renewal window often points to onboarding, communication gaps or unresolved maintenance requests rather than rent level.
Renewal incentives work best when they're offered before the notice period starts, not after. Contacting tenants 90 days ahead of lease end with a renewal offer, rather than waiting for a notice-to-vacate, consistently produces higher retention than reactive outreach. Combined with pre-letting during any eventual notice period, this keeps average tenancy duration climbing and turnover frequency falling, which is exactly the combination that shrinks economic vacancy without touching rent levels at all.
What does effective occupancy analytics look like in practice?
Two contrasting scenarios illustrate the gap between measuring occupancy well and measuring it badly.
A ten-unit portfolio tracking only physical vacancy reported 98% occupancy for a full year, which looked strong at every quarterly owner meeting. Once the manager reconciled 12 months of collections against gross potential rent, economic vacancy came out at 11%, driven by a renewal concession offered to three tenants and two months of unpaid arrears that had never been written off or flagged. The physical number was technically accurate and completely misleading.
A second, larger operator running 40 units across three submarkets used cohort analysis to spot that one submarket showed average tenancy duration of 14 months against 21 months elsewhere in the portfolio. Investigating the gap revealed a maintenance backlog specific to that building, not a rent or demand issue. Addressing the backlog rather than cutting rent brought tenancy duration back in line within two renewal cycles, without any pricing concession.
Neither outcome was visible from a rent roll or a single occupancy percentage. Both only surfaced once ledger data, tenancy dates and segmentation were reconciled together over a full year, which is the pattern behind nearly every account of vacancy erasing far more income than expected.
What goes wrong when collecting occupancy data?
Most occupancy reporting failures aren't calculation errors. They're data discipline failures that compound quietly until a review meeting exposes them.
The most common pitfall is relying on a rent-roll snapshot instead of a reconciled ledger. A rent roll shows what should be collected on a given day; it says nothing about concessions granted last quarter or arrears building up over three months. Treating that snapshot as if it represents annual performance is how portfolios get blindsided by economic vacancy figures that look nothing like what management expected.
A second issue is inconsistent data ownership. When lease dates live in one system, payments in another, and concessions in a spreadsheet nobody updates consistently, reconciliation becomes a monthly fire drill rather than a routine process. The fix is assigning a single owner per data source and automating the handoff between systems wherever possible, rather than relying on someone remembering to export a report.
A third, subtler problem is drawing conclusions from too short a window. A single strong month can mask a chronic turnover pattern that only becomes visible across a full year of ledger data, and a single weak month can be misleading as it may reflect normal seasonal variation. Reviewing a full 12-month reconciled ledger before making a pricing or renovation decision avoids both traps, and it's a discipline worth enforcing even when the monthly numbers look fine on their own.
Prop Report perspective: fixing the ledger problem at source
Every point above assumes a landlord or manager has the discipline and the systems to assemble a clean 12-month ledger every month, reconcile it against tenancy dates, and segment it by property. In practice, that's the part most portfolios never quite get to, not because the maths is hard but because the data lives in five different places.
Prop Report was built around that specific gap. It automates data reporting across the ledger, tenancy register and maintenance records, and it integrates with existing CRM and finance systems rather than asking managers to rebuild their workflow around a new platform. That integration is what turns a monthly reconciliation task, historically one of the biggest time drains in portfolio management, into something closer to a standing report that updates itself.
The platform's ISO 27001 certification highlights a commitment to data security, important because ledger data includes sensitive payment history and tenant financial information. For a manager running multiple properties, the practical expectation is fewer manual reconciliation errors, faster identification of which specific concessions or arrears are driving economic vacancy, and owner reports that reflect the ledger rather than a rent-roll guess.
— James
See how Prop Report handles the ledger for you
Reconciling a 12-month ledger by hand across a growing portfolio is exactly the kind of task that eats a manager's week without anyone noticing until the numbers don't add up. Prop Report automates that reconciliation, connects to your existing CRM and finance systems, and turns tenancy, payment and vacancy data into a live occupancy dashboard rather than a monthly spreadsheet exercise.
A demo will walk through exactly how the platform pulls occupancy and economic vacancy figures directly from your ledger, how integrations with your existing systems are set up, and how owner reporting looks once it's automated rather than assembled by hand. If manual reconciliation is currently your biggest reporting bottleneck, it's worth seeing how Prop Report's platform handles it before your next quarterly review. Book a demo and bring your own portfolio numbers to test against it.
Sources
The formulas and benchmarks in this article draw on a handful of sources worth bookmarking for further reading and for scenario modelling on your own portfolio.