

Portfolio benchmarking property means comparing operational KPIs, such as occupancy, rent collection and maintenance cost per door, across every asset you manage, using automated dashboards rather than end-of-month spreadsheets. Done properly, it surfaces underperforming units before they drag down net operating income and cuts hours off owner reporting. The first move is simple: pick 8 to 10 KPIs that actually drive decisions, and connect one high-value data source, usually your property management system, before you touch anything else.
TL;DR:
- Benchmark only 8 to 10 decision-critical KPIs like occupancy, rent collection, and maintenance cost per door; avoid tracking too many metrics that add noise.
- Build thresholds with at least 12 months of historical data, segment by asset class and vintage, to trigger clear, action-oriented rules such as collection escalations or vacancy reviews.
- Use automated systems that connect directly to PMS, accounting, and maintenance software to ensure real-time, trustworthy data, reducing manual reconciliation and errors.
- Focus on operational KPIs that directly influence cash flow and NOI, such as improving leasing cycles or reducing maintenance costs, rather than broad or static dashboards.
- Regularly compare internal benchmarks against local and national market trends to identify genuine gaps or competitive advantages, especially during market shifts.
Table of Contents
- What KPIs should you benchmark across a property portfolio?
- How do you set benchmarks and threshold rules that trigger action?
- How do you get live portfolio benchmarking running in five steps?
- How should you benchmark cap rates, NOI and cash-on-cash return?
- How does your portfolio compare with local and national market trends?
- How do you benchmark risk and diversification across your portfolio?
- What goes wrong with property portfolio benchmarking?
- What tools and platforms handle property portfolio benchmarking?
- What actually moves the needle in portfolio benchmarking?
- Ready to put automated benchmarking to work?
- Sources
What KPIs should you benchmark across a property portfolio?
Not every metric deserves a dashboard tile. Seven KPIs covering vacancy rate, days-to-lease, rent collection rate, maintenance cost per door, response time, owner retention and team workload per door give independent operators genuine operational visibility without drowning them in noise. Build from that base and add a handful more once the fundamentals are running.
Here is a working set, with who should own each number and what it should trigger:
- Occupancy rate (occupied units ÷ total units × 100). Owned by leasing. Refresh daily. A drop below your baseline triggers a marketing spend review.
- Rent collection rate (rent collected by due date ÷ rent billed × 100). Owned by accounting. Refresh daily during the first ten days of the month. A dip below threshold triggers a collections escalation call.
- NOI per asset (rental income minus operating expenses, per property). Owned by finance. Refresh monthly. (Specific monthly figures vary by property and portfolio and are not universally fixed.) Persistent underperformance triggers a full asset review.
- Maintenance cost per door (total maintenance spend ÷ unit count). Owned by operations. Refresh monthly. A spike flags a vendor or asset-condition problem.
- Days vacant / days-to-lease (average days between move-out and new lease start). Owned by leasing. Refresh weekly. Rising figures trigger a pricing or marketing review.
- Lead-to-lease conversion rate (signed leases ÷ qualified leads × 100). Owned by leasing. Refresh weekly. Low conversion triggers a leasing-process audit.
- First-time fix rate (work orders resolved on the first visit ÷ total work orders × 100). Owned by maintenance. Analytics-driven tracking of FTFR materially reduces operating costs and protects NOI, because every repeat visit means a second call-out fee and a frustrated tenant.
- Open work order ageing (average days work orders remain unresolved). Owned by maintenance. Refresh daily. Ageing beyond your SLA triggers vendor escalation.
- Renewal rate (renewed leases ÷ leases up for renewal × 100). Owned by leasing/asset management. Refresh monthly. A falling rate triggers a tenant satisfaction review.
Prioritise the KPIs that move cash or protect owner relationships first: collections, occupancy, and maintenance cost per door. Vacancy and days-to-lease matter, but a landlord notices a missed rent payment faster than a slow leasing funnel.
How do you set benchmarks and threshold rules that trigger action?
A benchmark without a threshold is just a number nobody acts on. Build your baseline from at least 12 months of your own portfolio's historical data, then layer in market context, such as published occupancy or maintenance-response benchmarks, as a sanity check rather than a target to copy blindly. Every portfolio has its own asset mix, so treat outside figures as a reference point, not gospel.
Segmentation matters more than most operators expect. A portfolio average can hide a badly underperforming block of 1990s-built flats sitting next to a newly refurbished block that is carrying the average upward. Segmenting by asset class, market and vintage exposes that drift before it becomes an owner complaint.
Turn each benchmark into a named rule with a clear action attached:
- Vacancy review: if occupancy drops more than 3 percentage points below the segment baseline for two consecutive weeks, trigger a pricing and marketing audit.
- Collections escalation: if rent collection falls below 95% by the fifth of the month, trigger a tenant contact sequence.
- FTFR alert: if first-time fix rate drops below your rolling average for a given vendor, trigger a vendor performance review.
Keep the working set to 8 to 10 decision-oriented KPIs. Adding more rarely improves decisions and mostly just adds noise to review meetings.
How do you get live portfolio benchmarking running in five steps?
Getting from spreadsheet chaos to a working benchmarking layer does not require a six-month project. Here is a practical sequence:
- Scope the KPI set and assign owners. Pick your 8 to 10 metrics, decide who owns each one, and agree the refresh cadence before building anything.
- Connect the highest-impact data source first. For most portfolios, that is the PMS or the accounting system, since occupancy and collections are the numbers owners ask about most.
- Model baselines and segment the portfolio. Use historical data to set realistic starting points, split by asset class and vintage, and flag the outliers early.
- Build dashboards and automated alerts. Tie each threshold rule to a named action so the dashboard produces decisions, not just charts.
- Embed the operating cadence. Run a weekly ops review of your headline KPIs, automate the owner report from the same underlying data, and maintain a vendor scorecard alongside it.
Weekly review cadence pays off quickly. One practical approach is to review 4 to 6 headline KPIs each week and select a single underperforming asset for focused root-cause work, rather than trying to fix everything at once. That kind of live dashboard combined with clear decision rules has been linked to measurable reductions in vacancy days and improvements to NOI once operators move away from static monthly reporting.
Resist the temptation to track everything the software offers. Vendor guidance across the industry consistently points toward a small, disciplined KPI set as the fastest route to impact, because a shorter list gets reviewed properly every week instead of being glanced at once a month.
How should you benchmark cap rates, NOI and cash-on-cash return?
Operational KPIs tell you what is happening day to day. Financial performance metrics tell you whether the portfolio is actually making money, and the two need to sit side by side in your reporting.
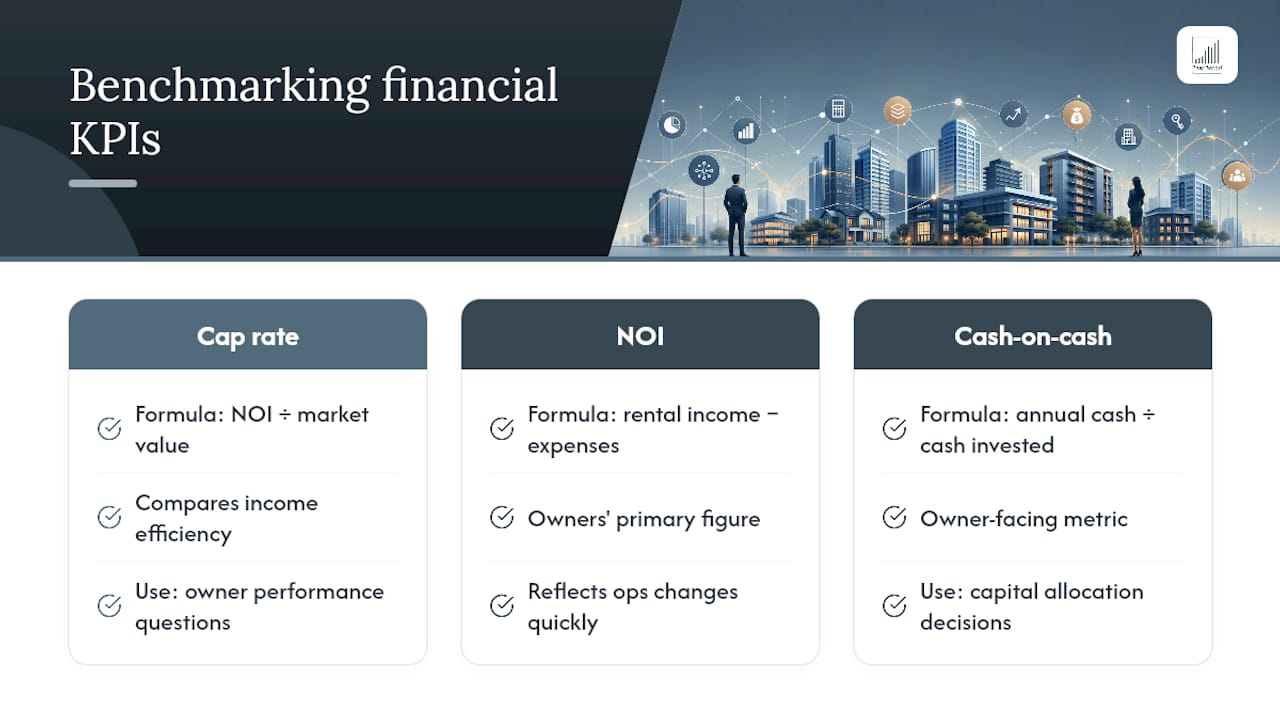
Cap rate (net operating income ÷ current market value) lets you compare the income-generating efficiency of assets regardless of size, which is useful when a landlord asks why one building outperforms another. NOI itself (gross rental income minus operating expenses, excluding debt service) is the figure most owners care about most, and it is directly downstream of the operational KPIs already covered: a falling first-time fix rate or rising vacancy will show up here within a quarter or two. Cash-on-cash return (annual pre-tax cash flow ÷ total cash invested) matters most to owners evaluating whether their capital would work harder elsewhere, so it belongs in owner-facing reports even when it is not something operations teams act on daily.
The connection between operational and financial metrics is not abstract. A maintenance cost per door that creeps up 15% over a year will erode NOI even if occupancy stays flat, and a slow leasing funnel that adds a week to average days vacant compounds into a measurable dent in cap rate across a large portfolio. Tools such as a rental property ROI calculator can help translate an operational improvement, say, a faster leasing cycle, into its cash flow and cap rate impact, which makes the case for operational investment easier to put in front of an owner.
Benchmark these financial figures against your own portfolio's trailing 12-month average first, then against comparable assets in the same segment, rather than against unrelated property types.
How does your portfolio compare with local and national market trends?
Internal benchmarks tell you whether an asset is improving. Market benchmarks tell you whether that improvement is actually competitive, and the two questions have different answers more often than operators expect.
A property holding steady at 92% occupancy might look fine against last year's internal baseline, but if the local submarket is running at 96%, that gap represents real lost revenue that internal-only benchmarking will never surface. Comparable exposure works the other way too: a portfolio slightly below its own trailing average during a broader market downturn may actually be outperforming its peers, which changes the conversation with an owner from "what went wrong" to "we held up better than the market."
Useful external reference points include local rent growth data, submarket vacancy rates published by commercial data providers, and national maintenance-response benchmarks. Cross-reference these against your segmented internal figures, asset class by asset class, rather than blending everything into a single portfolio-wide comparison. A student-housing block and a family-let block in the same city rarely move with the same market dynamics, so comparing both against one blended market figure produces a misleading picture.
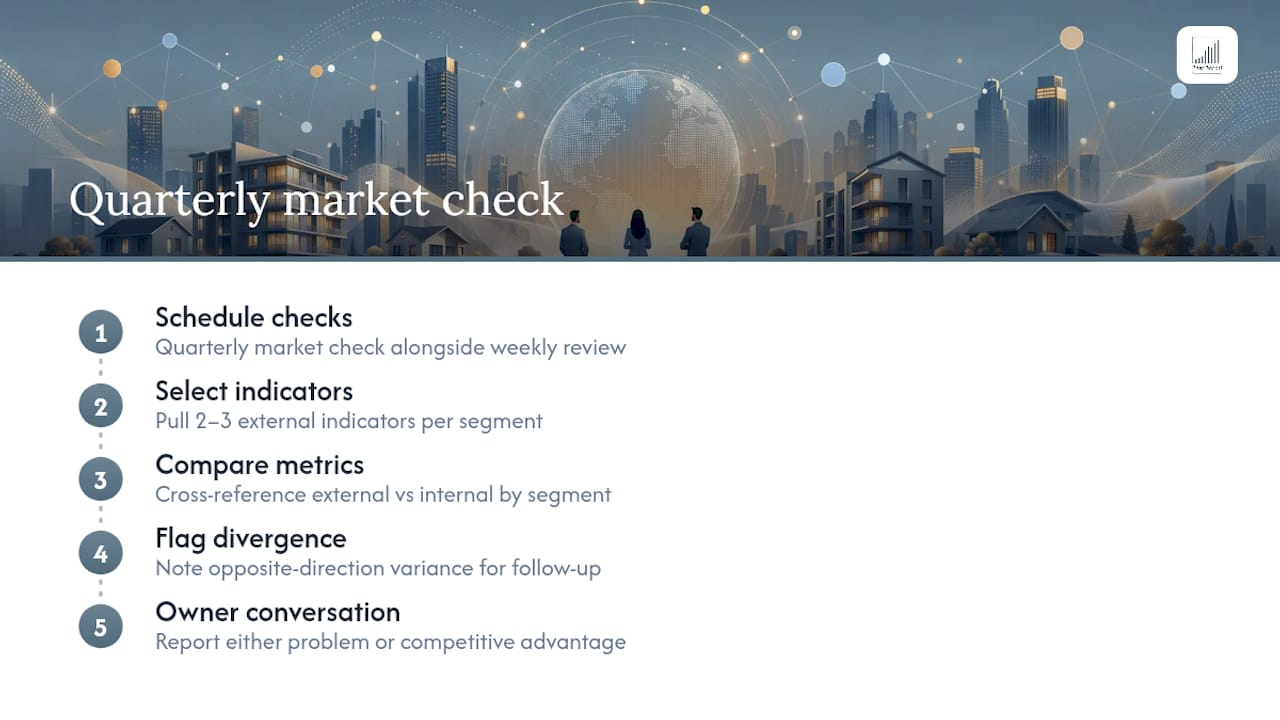
The practical habit worth building is a quarterly market check alongside your weekly operational review: pull two or three external indicators for each segment, note the variance against your internal numbers, and flag anything moving in the opposite direction to the wider market. That divergence is usually the first sign of either a genuine local problem or a genuine competitive advantage, and either one is worth an owner conversation.
How do you benchmark risk and diversification across your portfolio?
Concentration risk hides easily inside a portfolio that looks healthy on average. If 40% of your NOI comes from three assets in one submarket, a single local disruption, a major employer relocating, a planning change, a competing development opening nearby, can hit your numbers far harder than the blended portfolio average suggests.
Benchmarking risk means tracking exposure across several dimensions simultaneously: geographic concentration (what share of income comes from each submarket), asset class concentration (residential versus commercial, or single-family versus multifamily), tenant concentration for commercial holdings, and vintage concentration, since older buildings carry higher and less predictable maintenance risk. None of these show up in a single blended occupancy or NOI figure, which is exactly why segmentation, discussed earlier for baseline modelling, matters again here.
A useful discipline is to calculate what share of total portfolio NOI each segment contributes, then compare that against the share of total risk exposure it represents. A segment contributing 15% of income but carrying 35% of your open maintenance tickets or your worst renewal rate is a diversification imbalance worth flagging to ownership, even if the portfolio-wide numbers look stable.
Diversification benchmarking is not about spreading assets thinly for its own sake. It is about knowing, with data rather than instinct, where your portfolio's next shock is most likely to come from, and making sure no single segment can quietly erode the whole portfolio's performance before the monthly report catches it.
What goes wrong with property portfolio benchmarking?
Most benchmarking efforts fail for predictable reasons, and nearly all of them are fixable once you know to look for them.
Tracking too many metrics. Dashboards that display thirty KPIs get glanced at, not acted on. Cut ruthlessly to the 8 to 10 that actually drive a decision.
Comparing blended averages instead of segments. A portfolio average smooths over the exact outliers you need to see. Segment by asset class and vintage before drawing conclusions, as covered earlier.
Inconsistent KPI definitions across teams. If leasing calculates "days vacant" differently to how finance reports it, your numbers will never reconcile, and owners will lose confidence in the reporting the moment they spot a mismatch.
Stale or manually reconciled data. Monthly spreadsheet pulls cannot support weekly decision-making. If a KPI is meant to trigger an escalation, its refresh cadence needs to match the speed of the decision, not the speed of your reporting cycle.
No threshold rules attached to the numbers. A dashboard full of charts with no defined action is a reporting tool, not a benchmarking system. Every KPI needs a named rule and a named owner, as set out in the threshold section above.
Ignoring data-quality checks during integration. Mis-tagged maintenance spend or duplicated leasing records quietly distort benchmarks for months before anyone notices. Build the validation habit in from day one rather than retrofitting it later.
What tools and platforms handle property portfolio benchmarking?
Operators generally reach for one of three approaches, and each has a different trade-off between control and speed.
Spreadsheets remain common for small portfolios, and they cost nothing to start. They also break down fast once you are managing more than a handful of properties across multiple data sources, because manual reconciliation cannot keep pace with daily decision-making.
Business intelligence platforms built for general analytics can be wired up to property data with enough engineering effort, giving flexible dashboards. The setup cost is real, though, since these tools were not built with property-specific KPI definitions or PMS integrations out of the box.
Purpose-built property management platforms connect directly to PMS, accounting, and maintenance systems, and arrive with property-specific KPI definitions already modelled. Propreport falls into this category, combining automated data reporting with integration into existing CRM systems, which removes much of the manual joining work described earlier in this guide.
Whichever category you choose, the trust signals that actually matter are the same: clear, published KPI formulas so every team calculates the same metric the same way; a refresh cadence that matches decision speed rather than reporting convenience; and independently verified data security. ISO 27001 certification is one such marker worth checking for, given how much sensitive tenant and financial data flows through a benchmarking platform.
What actually moves the needle in portfolio benchmarking?
Most guidance on this topic reads like a features list: connect everything, track everything, visualise everything. That advice is backwards. The portfolios that get real value from benchmarking start narrow, with a handful of KPIs that map directly to a decision, and expand only once those decisions are demonstrably better.
The conventional wisdom overrates dashboards and underrates decision rules. A beautiful chart showing occupancy trending downward is useless if nobody has defined what happens next. Naming the action, a collections escalation, a vendor review, a pricing audit, is what turns a metric into an operating system rather than a report nobody reads twice.
If you take one thing from this guide, prioritise the joining problem before the visualisation problem. Most operators default to buying dashboard software before they have solved how their PMS, accounting, and maintenance data actually reconcile. Get that plumbing right first, even if the first version of your dashboard looks unglamorous. Everything else, segmentation, threshold tuning, owner reporting, gets easier once the underlying data can be trusted without a manual check every week.
*— James
Ready to put automated benchmarking to work?
There are property management platforms that turn the five-step playbook above into something you can switch on rather than build from scratch. It connects to your existing systems, pulls occupancy, rent collection, maintenance and leasing data into one automated view, and updates it without anyone exporting a spreadsheet.
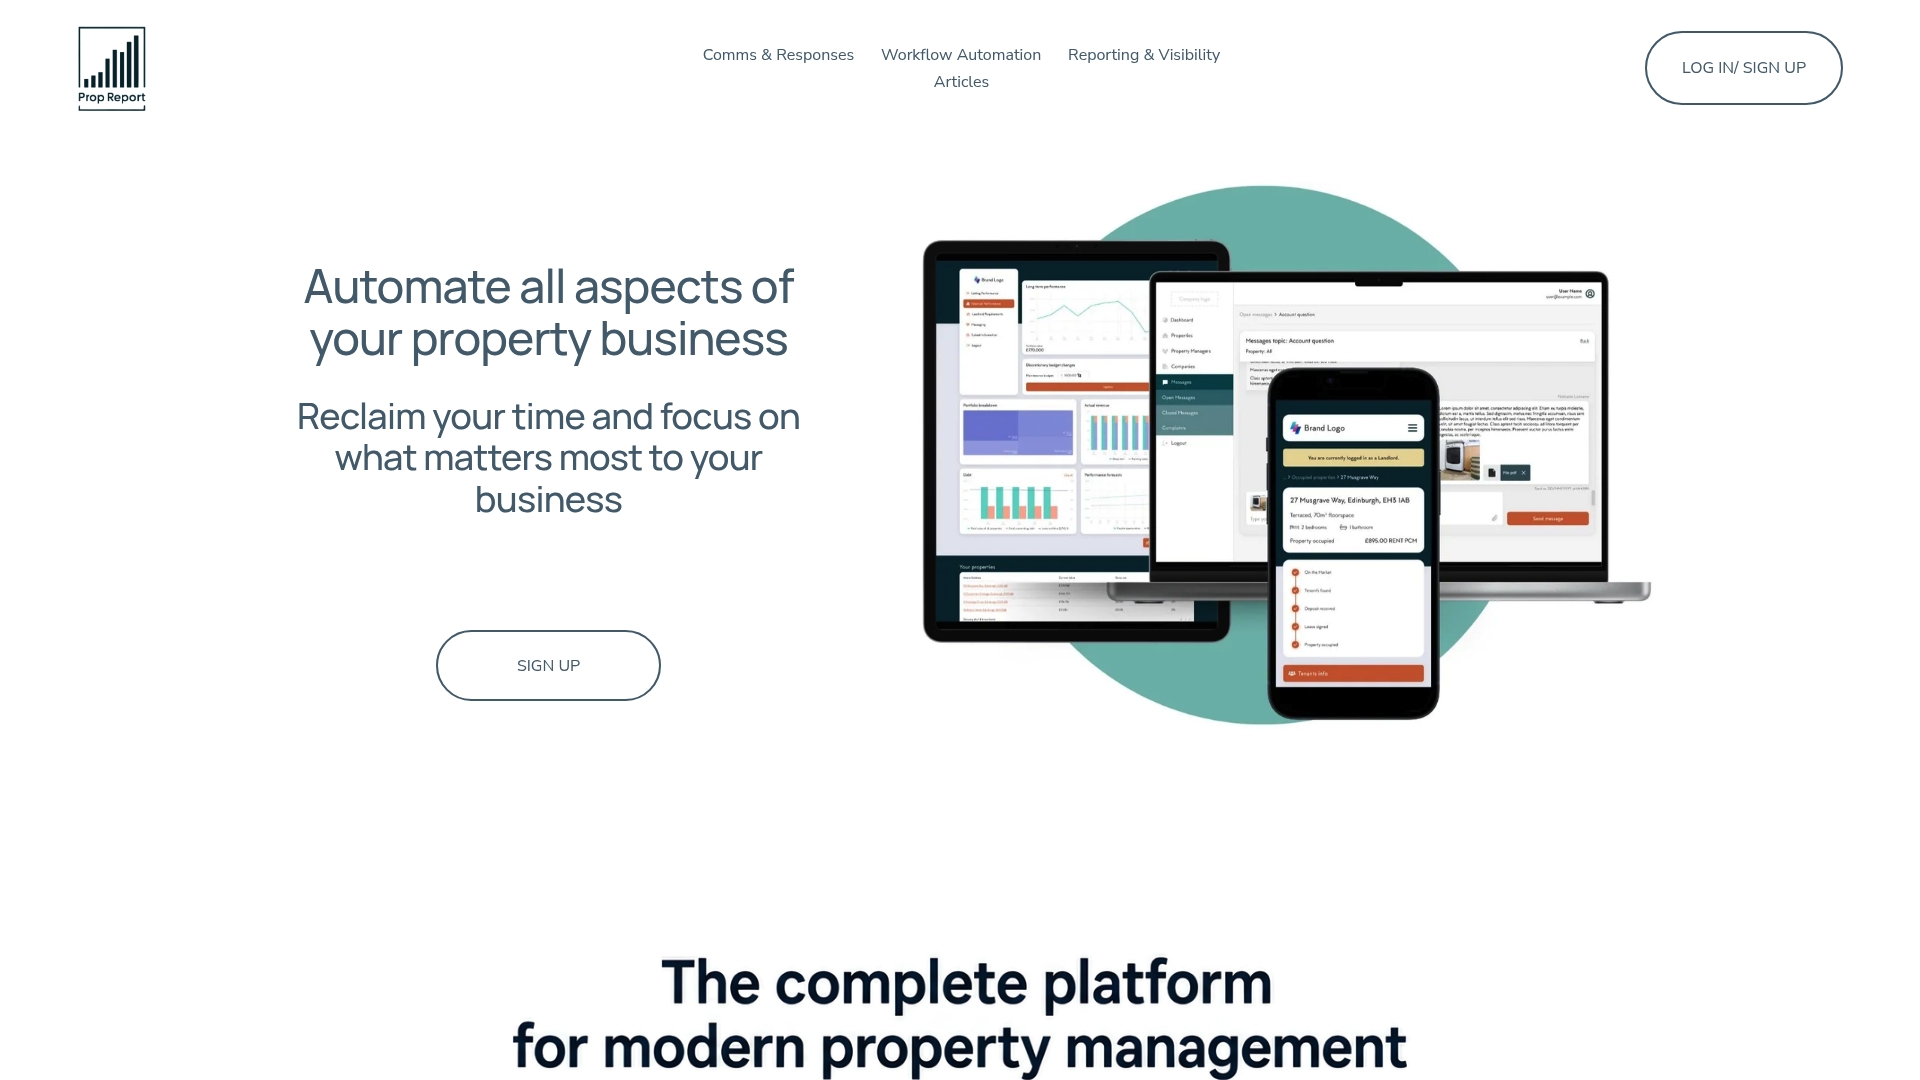
Such platforms may map directly onto operational KPIs and threshold rules covered in this guide: automated data reporting replaces manual reconciliation, integration with existing CRM systems keeps leasing and maintenance data in sync, and owner-facing reports generate from live figures reviewed weekly, reducing the need for multiple data versions. Vendor and maintenance performance, including first-time fix rates, can feed into dashboards used for weekly operational reviews. Data security on ISO 27001-certified infrastructure is important for platforms handling sensitive financial and tenant data in benchmarking systems. If your reporting still relies on manually joining PMS exports with a spreadsheet each month, see how Propreport's AI-driven property management tools handle that automatically, or head to the landlord features page to see how owner reporting looks from the other side. Booking a demo is the fastest way to see your own portfolio's data running through it.
Sources
Benchmarking only works if the numbers underneath it are trustworthy, and that means being deliberate about where each figure comes from. Four systems typically feed a benchmarking layer: the property management system (PMS) for occupancy and leasing data, the accounting or general ledger for collections and expenses, maintenance ticketing software for work orders and response times, and the leasing CRM for lead and conversion data. Owner ledgers sit alongside these as the record you report back against.
Integration usually happens one of three ways:
- Property management KPIs that actually matter for independent operators | Veyra Group
Refresh cadence should match how fast a decision needs to happen. Maintenance and leasing-funnel data benefits from near real-time updates, while occupancy and collections figures are best refreshed daily during critical windows, such as the first week of the month. Closed financials, including NOI, only need a monthly refresh once the books are settled. Combining occupancy, NOI, maintenance costs and leasing data into one operating view rather than siloed reports is what lets you spot an underperforming asset by its variance from the rest of the portfolio, not just its raw number.
Pro Tip: Before connecting a second data source, run a two-week validation check on the first one. Compare five random work orders or leases against the source system by hand. A mapping error caught early saves weeks of mis-tagged spend later.