

Track these eight first: revenue per door, net operating income (NOI), occupancy rate, rent collection rate, tenant turnover/renewal rate, maintenance cost per unit, average days to lease and work order backlog. Move on any of these and something in the business has genuinely changed, either for better or worse.
Each one earns its place because it triggers a specific action. Rent collection rate slips below target, you escalate arrears the same week. Days to lease climbs, you check pricing before you check marketing spend. Work order backlog grows, you're looking at a vendor or staffing problem, not a one-off bad week.
- Daily: rent collection rate, work order backlog
- Weekly: occupancy rate, maintenance response times, leasing pipeline
- Monthly: NOI, revenue per door, tenant turnover/renewal, operating expense ratio
Pro Tip: If you're checking more than 10 numbers regularly, you've probably built a report, not a management tool. Cut it back to what changes your Monday.
Key Takeaways
Property management KPIs work only when a small headline set is reviewed on the right cadence and each number has a named owner responsible for acting on it.
| Point | Details |
|---|---|
| Track eight headline KPIs | Revenue per door, NOI, occupancy, rent collection, turnover, maintenance cost, days to lease, work order backlog. |
| Match cadence to impact | Review collection and backlog daily, occupancy and response times weekly, NOI and revenue monthly. |
| Segment leasing data | Break days to lease and loss to lease down by unit type to find hidden long-tail vacancies. |
| Automate the dashboard | Pull live feeds from your PMS, ledger and maintenance system rather than rebuilding spreadsheets manually. |
| Assign ownership per KPI | A number with no named owner tends to drift unnoticed until it becomes a structural problem. |
Table of Contents
- Financial KPIs: how to calculate and act on them
- Leasing and occupancy KPIs: occupancy, vacancy and days to lease
- Maintenance and operations KPIs: cost, response time and backlog
- Tenant and owner satisfaction KPIs: what to measure and how often
- How to implement KPIs in practice: dashboards, cadence and data ownership
- Choosing and sizing KPIs: how many to track and how to set targets
- Tools, data sources and quick setup checklist
- Lease expiration and lease compliance rates
- Property inspection frequency and findings
- Budget variance analysis
- Marketing effectiveness for tenant acquisition
- Capital expenditure (CapEx) tracking
- Bring your KPI reporting together in one place
- Why dashboard-first beats spreadsheet-first every time
- Sources
Financial KPIs: how to calculate and act on them
Net operating income is the number that tells you whether a property is actually working. Calculate it as gross rental income minus operating expenses, excluding mortgage payments and capital costs: NOI = Gross Rental Income − Operating Expenses. Track it monthly rather than quarterly, because a single missed rent payment or an unplanned repair can distort a quarterly figure just enough to hide a real trend underneath it.
Revenue per door strips out the noise of portfolio size and lets you compare a 12-unit block against a 40-unit one on equal terms. You calculate it by dividing total rental revenue by the number of units under management over the same period. Tracking this KPI over time can reveal whether rents are keeping pace with the market, or if vacancy or concessions are impacting revenue. Track this over time, and a falling figure usually means one of three things: rents haven't kept pace with the market, vacancy is creeping up, or concessions are quietly eating into the top line.
The Buildium property management KPI framework treats revenue growth, NOI, occupancy and rent collection as the core financial cluster, and for good reason. These four numbers together tell you almost everything about whether a portfolio is healthy.
Operating expense ratio divides total operating expenses by gross operating income. Start with three places: maintenance spend (is reactive work replacing preventive work?), utility costs (are void units burning energy unnecessarily?), and vendor contracts (has a supplier crept up on pricing without renegotiation?).
Rent collection rate is simply rent collected divided by rent due, expressed as a percentage. A low collection rate deserves a look at your delinquency ageing buckets:
- 0 to 15 days late: automated reminder, no escalation needed yet.
- 16 to 30 days late: personal contact from the property manager, payment plan offered.
- 31 to 60 days late: formal notice issued, legal process considered.
- 60+ days late: treat as a write-off risk and involve legal counsel.
For benchmarking rental income trends against the wider market, Gov give a reliable, government-sourced baseline rather than relying on anecdote from a single portfolio.
Leasing and occupancy KPIs: occupancy, vacancy and days to lease
Physical occupancy and economic occupancy tell different stories, and confusing the two is one of the more expensive mistakes in the industry. Physical occupancy is simply occupied units divided by total units. Economic occupancy factors in the rent you're actually collecting against the rent you could collect at full market rate, adjusted for concessions and unpaid arrears. A property can sit at 98% physical occupancy while economic occupancy limps along at 88% because half the tenants are on move-in discounts and a few are behind on payments.
Average days to lease measures how long a unit sits empty between tenancies. The mistake most managers make is tracking a single portfolio-wide average. Segment it instead by unit type and price point. A three-bedroom house that takes 40 days to lease while one-bedroom flats turn over in 12 tells you exactly where your pricing or marketing problem lives, rather than burying it in a blended figure that looks fine on the surface.
Loss to lease measures the gap between the rent you're charging existing tenants and current market rent for equivalent units. Run this calculation quarterly across your portfolio:
- Identify units renewed more than 12 months ago.
- Compare their current rent to today's asking rent for comparable units.
- Total the gap across the portfolio to see revenue left on the table.
- Flag units for rent review at the next renewal window.
Renewal rate deserves more attention than most managers give it. A falling renewal rate is an early warning that acquisition costs are about to rise, since replacing a tenant costs far more in marketing, void periods and admin than retaining one.
Maintenance and operations KPIs: cost, response time and backlog
Maintenance cost per unit and cost per make-ready are the two figures that quietly determine whether your margin survives the year. Calculate maintenance cost per unit by dividing total annual maintenance spend by the number of units, and make sure you're capturing contractor mark-ups, not just the invoice line for parts and labour. It's easy to undercount here, and undercounting here is how budgets blow out three months later without anyone noticing until the accounts are reconciled.

Response time and mean time to resolve (MTTR) sit close to the top of the operational list. Response time is measured from when a request lands to when a technician first engages; MTTR runs from request to full resolution. Slow response correlates directly with lower tenant satisfaction and higher renewal risk, which is exactly the kind of number that looks small on a spreadsheet and shows up later as a vacancy.
Reasonable thresholds to work towards:
- Emergency requests: response within 2 hours, resolution within 24 hours.
- Urgent (non-emergency): response within 24 hours, resolution within 3 days.
- Routine requests: response within 48 hours, resolution within 7 days.
Work order backlog, first-time-fix rate and callback rate round out the operational picture. A growing backlog signals either understaffing or a vendor who's overcommitted elsewhere. A high callback rate, where the same issue gets reported twice within 30 days, almost always points to a training gap or a contractor cutting corners on the first visit.
Pro Tip: Track your preventive-to-reactive maintenance ratio separately. A portfolio doing more preventive work than reactive work typically sees lower long-term costs and fewer emergency callouts, because problems get caught before they become expensive.
Tenant and owner satisfaction KPIs: what to measure and how often
Tenant satisfaction is measurable, and it doesn't need a complicated survey instrument to be useful. A simple post-interaction score after every maintenance visit, plus a quarterly portfolio-wide satisfaction survey, gives you enough signal without survey fatigue setting in. Ask two questions maximum: how satisfied were you with this interaction, and how likely are you to renew?
Owner satisfaction gets tracked far less rigorously than tenant satisfaction, which is a mistake if you're managing on behalf of landlords rather than owning the stock yourself. Owner churn, the rate at which landlords leave your management for a competitor or self-management, is the commercial equivalent of tenant turnover. Report it alongside NOI and occupancy in owner-facing updates, because a landlord who sees transparent numbers is far less likely to walk.
Two operational drivers worth watching:
- Portal adoption rate: what percentage of tenants and owners actively use your communication portal rather than calling or emailing.
- Communication SLA compliance: what percentage of enquiries get a first response within your stated target window.
Both numbers are leading indicators. Low portal adoption usually precedes rising phone volume and slower response times across the board, which then shows up in satisfaction scores a month or two later.
How to implement KPIs in practice: dashboards, cadence and data ownership
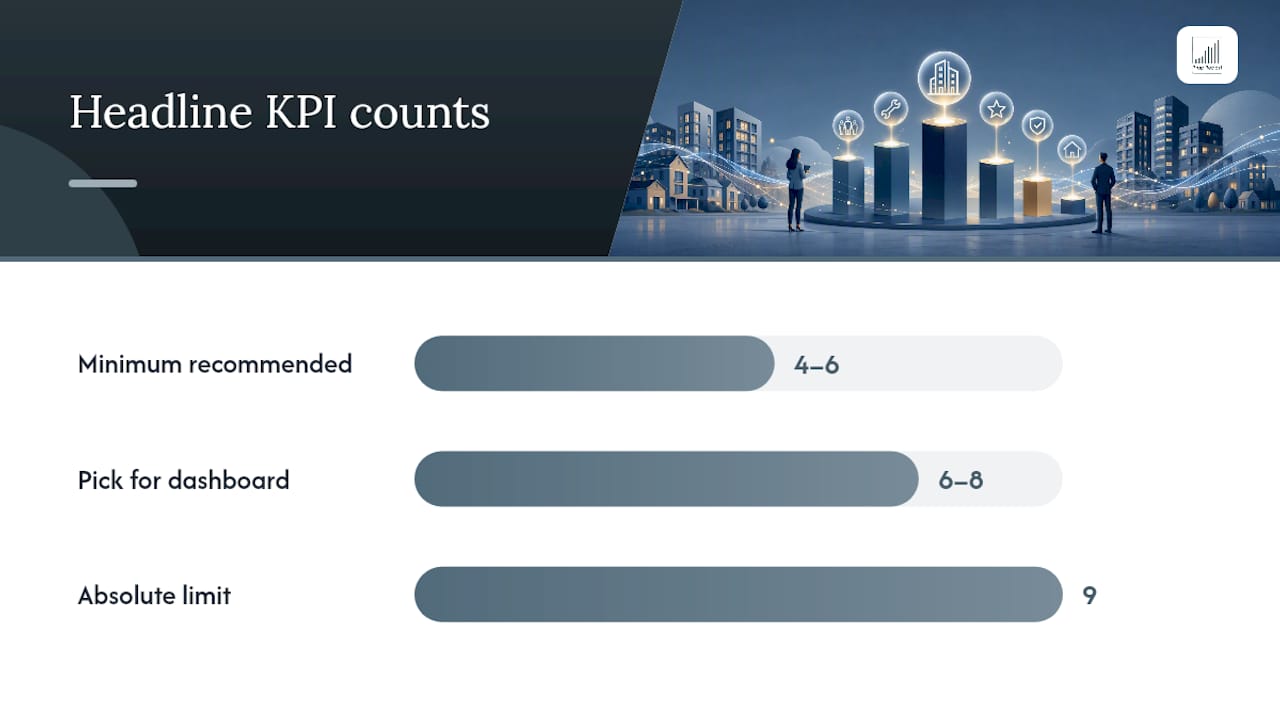
A dashboard that works follows one design rule: 4 to 6 headline KPIs above the fold, with drilldowns available for anyone who needs the detail behind a number. Dashboard best practice from Usedatabrain makes the same point: cram in more than six headline figures and people stop looking at the dashboard altogether, because scanning it becomes work rather than a five-second check.
- Pick your headline six to eight from the categories above, and resist the urge to add a ninth.
- Automate the data feeds from your property management system, general ledger, and maintenance platform, rather than pulling numbers into spreadsheets by hand each week.
- Assign an owner to every KPI. A number with no named owner drifts quietly until someone finally asks why it's been red for three months.
- Set alert thresholds, not just target values, so a KPI moving out of range triggers a notification rather than waiting to be spotted at month-end review.
- Review on the right cadence: daily for collection and backlog, weekly for occupancy and response times, monthly for NOI and revenue per door.
The manual alternative, logging into four different systems and stitching together three spreadsheets before a Monday meeting, is exactly the lag that turns a fixable problem into a structural one. This is where a platform like Arthur from Propreport earns its place, pulling live data from your existing PMS, finance ledger and maintenance system into one dashboard rather than asking your team to reconcile them manually.
Security matters here too, not as an afterthought but as a precondition. Any platform centralising tenant financial data and personal information needs a credible security standard behind it. ISO 27001 certification is the benchmark worth checking for before you hand over sensitive portfolio data to any system.
Pro Tip: Build the dashboard around the decisions your team actually makes, not the metrics that look impressive in a board pack. If a number never changes what someone does on a Tuesday, it doesn't belong above the fold.
Choosing and sizing KPIs: how many to track and how to set targets
More KPIs rarely means better management. Industry practice consistently points towards a small core set: three strategic KPIs (NOI, revenue per door, portfolio occupancy) that tell you how the business is performing overall, and six to eight operational KPIs that tell your team what to fix this week.
- Set targets from your own history first. Twelve months of your own data is a better baseline than an industry average that ignores your specific unit mix and location.
- Layer in market data second, using sources like gov.uk rental statistics to sanity-check whether your numbers are in line with the wider market or an outlier worth investigating.
- Group KPIs into buckets (financial, leasing, operational, satisfaction) and match review cadence to how quickly each bucket changes.
- Prune ruthlessly. If a KPI hasn't triggered a single decision in three months, drop it from the headline view.
Watch for the warning signs of KPI clutter: dashboards nobody opens, weekly meetings that spend more time explaining numbers than acting on them, and metrics that duplicate each other under different names.
Tools, data sources and quick setup checklist
Five systems feed a working KPI dashboard: your property management system for occupancy and leasing data, your general ledger for financials, your maintenance system for work orders and response times, your tenant portal for communication and satisfaction signals, and your payment processor for collection rates.
Getting from spreadsheets to a live dashboard takes roughly these steps:
- Define what decisions the dashboard needs to support before choosing metrics.
- Pick your headline six to eight KPIs and write down the formula for each one.
- Map which system owns which data point, and name a person responsible for each feed.
- Automate the connections rather than exporting CSVs manually.
- Validate every formula against a manual calculation for one month before trusting it fully.
Think in terms of categories, property management system, accounting software, maintenance platform, rather than specific vendors, when planning integrations. The category matters more than the brand for getting the data flowing correctly.
Lease expiration and lease compliance rates
Lease expiration tracking prevents the single most avoidable void period in the business: the one caused by nobody noticing a lease was ending until the tenant had already found somewhere else. A rolling 90-day lease expiration report, showing every tenancy ending in the next three months, gives your team enough runway to start renewal conversations before a tenant starts looking elsewhere.
Lease compliance rate measures what percentage of active leases meet your required documentation and legal standards: signed agreements on file, deposit properly registered, safety certificates current, insurance requirements met where applicable. This isn't a glamorous metric, but it's the one that surfaces during a dispute or an inspection when it's too late to fix cheaply.
Calculate it simply: compliant leases divided by total active leases, expressed as a percentage.
Review lease expiration monthly at minimum, with a 90-day and 30-day flag built into the dashboard. Review compliance rate quarterly, or immediately after any regulatory change affecting deposit protection, safety certification or tenancy agreements. Treat both as leading indicators for turnover and legal risk, not just an administrative housekeeping task.
Property inspection frequency and findings
Inspection frequency depends on tenancy type and risk profile, but most well-run portfolios settle on a routine inspection every six months for standard residential tenancies, with more frequent checks for higher-risk properties or new tenancies in their first six months. Move-in and move-out inspections happen every time, without exception, since these two create the documented baseline that protects both landlord and tenant in any deposit dispute.
The KPI worth tracking isn't just frequency, it's findings rate: what percentage of inspections surface an issue requiring follow-up action, whether that's a maintenance request, a compliance breach, or a tenancy standard concern. A findings rate climbing over time across a portfolio, rather than being isolated to one or two problem properties, usually points to a systemic issue: ageing stock, an overstretched maintenance team, or inspection quality dropping because visits are being rushed.
Track average time from finding to resolution separately from the maintenance backlog KPI, since inspection findings sometimes get lower priority than tenant-reported issues, even when they're more serious. A cracked window frame a tenant hasn't complained about yet can become an expensive repair if it sits on an inspection report for two months without action.
Budget variance analysis
Budget variance compares actual spend and income against what you forecast at the start of the period, expressed as a percentage difference. Calculate it monthly for every major expense category: Variance = (Actual − Budgeted) ÷ Budgeted × 100. A maintenance line running 15% over budget in month three of the year is a very different problem to the same overrun appearing in month eleven, and the KPI only becomes useful once you're tracking it against the calendar, not just the total.
Favourable and unfavourable variance need different responses. Spend coming in under budget on maintenance sounds good until you check whether preventive work got deferred to hit the number, which usually shows up as a reactive maintenance spike a few months later. Unfavourable variance on utilities during a void period is often just a sign the unit needs to lease faster, not a budgeting failure.
Review variance monthly alongside NOI, and flag any category running more than 10% off forecast for a written explanation from whoever owns that budget line. This keeps small drifts from compounding into a year-end surprise that nobody can explain by the time the annual accounts get reviewed.
Marketing effectiveness for tenant acquisition
Cost per lead and cost per lease are the two numbers that separate marketing spend that works from spend that's just visible. Cost per lead divides total marketing spend by the number of enquiries generated; cost per lease divides the same spend by the number of leases actually signed. A channel generating cheap leads that never convert is more expensive than it looks on the surface.
Track conversion rate by channel separately, since portfolio-wide averages hide which listing sites, referral sources or paid campaigns are actually producing tenants versus just producing enquiries. A property manager running campaigns across three or four channels without this breakdown is usually overspending on at least one of them without realising it.
Time to first enquiry after listing is a useful early signal, particularly when segmented by unit type and price point, echoing the same segmentation logic that matters for average days to lease. A one-bedroom flat generating no enquiries within 48 hours of listing almost always has a pricing or photography problem, and catching it that early saves weeks of unnecessary vacancy.
Capital expenditure (CapEx) tracking
CapEx tracking separates the money spent maintaining a property from the money spent improving it, and mixing the two up is one of the more common reporting errors in the industry. A new roof or a full kitchen refurbishment is CapEx; a repaired tap or a repainted wall is operating expense. Getting this split right matters because it directly affects your NOI calculation, and a manager who miscategorises CapEx as operating expense will show a misleadingly low NOI for that period.
Track CapEx against a rolling annual budget per property, with a running total of committed versus spent, so you can see upcoming capital needs before they become urgent. A ten-year roof due for replacement in eighteen months should be visible in the CapEx plan well before it becomes an emergency repair line in the maintenance budget instead.
Report CapEx to owners separately from operating performance, ideally with a payback or value-uplift estimate attached to major projects. An owner reviewing a large capital spend wants to see the reasoning, not just the invoice total, and this is exactly the kind of reporting that owner portals handle far better than an emailed spreadsheet attachment.
Bring your KPI reporting together in one place
The manual route, spreadsheets rebuilt every week from four different logins, is the reason most portfolios only discover a problem after it's already cost money. Prop Report's landlord tools give owners direct visibility into the numbers that matter, while Arthur automates the data feeds from your PMS, finance ledger and maintenance system into a single live dashboard with ISO 27001-certified security behind it. That combination, headline KPIs above the fold, automated feeds, and owner-level transparency, is the difference between reviewing performance monthly and actually managing it daily.
Why dashboard-first beats spreadsheet-first every time
The conventional advice on KPIs treats them as a reporting exercise, something you prepare for an owner meeting or a quarterly review. That framing is backwards. A KPI that only gets checked monthly is a postmortem, not a management tool. The real value shows up when collection rate, backlog and response times are visible daily, because that's the window where a small problem is still cheap to fix.
Most portfolios don't have a KPI problem, they have a plumbing problem. The data exists somewhere in the PMS, the ledger, the maintenance log, but nobody's connected it into one place, so it gets rebuilt from scratch every week at real cost in time and attention. Fix the plumbing before you fix the metric list.
If you take one thing from this guide, prioritise automated feeds over adding more KPIs. Six well-connected numbers reviewed daily will outperform twenty numbers reviewed once a quarter, every time.
— James